
Visualize and analyse
Visualize
A picture is worth more than a thousand words. Visualizing your company’s networks can reveal features about how knowledge flows and give insight into how well the networks actually function.
Visuals make the invisible visible and indicate who takes key network roles. Key network roles are:
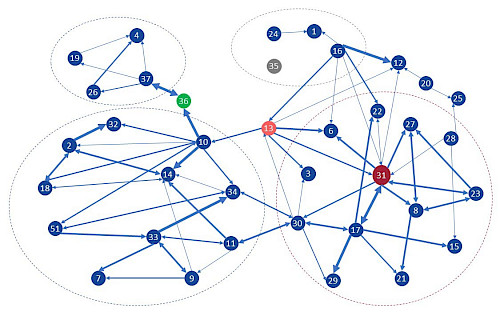
- Connectors: People with many direct connections. E.g. #31 is a connector with many people she connects to.
- Influencers: people closely connected to the different parts of a network. E.g. #13 is an influencer with connections to different groups.
- Brokers: People who tie together otherwise disconnected people and sub-groups. Often they connect people that otherwise would be isolates. E.g. #36 is the only one to connect to an otherwise separated knowledge cluster.
- Isolates: People with no or just a single connection. E.g. #35 is an isolate – does he have relevant knowledge others can benefit from?
Analyse
Visualization is the first step. Interpretation of the visuals is another challenge. Shapes of networks explain many important things about knowledge transfer, innovation, and performance of an organisation.
The visuals provide answers to a number of questions, such as: How well connected are groups (e.g. divisions or business units)? Are there redundancies in the connections present in a network, and what does that mean for innovation efficiency and performance? And in general: How to improve the networks in your company for better innovation?
InnoNetWorks is there to help you in four crucial steps: (1) visualize the networks (2) help interpret the visuals, and (3) together with you design intervention scenarios, (4) support the implementation of changes.
Back to Services